The Same, Only Different: Reclassifying Serve Reception in Volleyball, part 2
Single match data, xFB again but with aces, and closing thoughts
This is part three of a three-part series. Read the other parts by clicking on the links below.
If you want this to make sense, you should read Part 1 first.
Let's get back into it by looking at data from a single match to see what G-Y-R can look like.
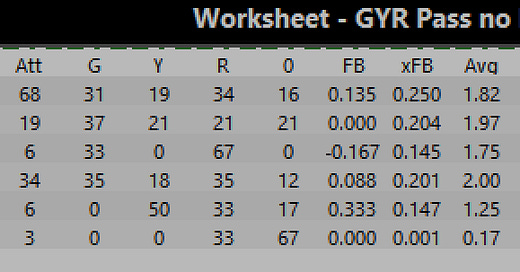
The image above is part of a simple Data Volley worksheet I built to compare reception average, xFB, and G-Y-R. The data make it pretty clear that all three are pretty tightly related, if one value looks good, the others likely do too. The upper team in the worksheet passed 50% of their receptions at a grade of “one” or lower (34% R + 16% 0) and that distribution was reflected in the low xFB and reception average values. Meanwhile, the lower team had 50% G and had xFB and reception average values that were in line with that. If the numbers are all so closely aligned, then aren't xFB and G-Y-R superfluous? I don't think so because I don't think that reception average gives us a clear indication of how often a team should score. I don't like relying on only xFB because it is too easy to conflate its value with reception averages. (Look at how closely the values of the two measures can seem.) Both xFB and reception average boil a passer's performance down to a single number which removes valuable context. Passers are not going to pass every ball the same but xFB and reception average give us the sense that every ball will be the same because they each give a single value. G-Y-R helps us very quickly understand that passes will be different and gives us a sense of how the passes will be distributed. Compare two passers on the upper team, one at 1.97 and the other at 2.00. If I was deciding who to serve at based only on those reception averages, they are practically the same but the G-Y-R gives me an interesting insight. While their G and Y percentages are almost the same, their R and 0 percentages are not. The 2.00 passer gives their team more attacks than the 1.97 passer (35 R% vs. 21 R%), something that doesn’t really come across from a 0.03 difference in reception average. That difference means about one additional first ball attack out of every 10 passes. It may not seem like much but it does mean additional chances to win rallies.
There is a way to create a bit more difference between reception average and xFB. Since xFB is more about scoring than about reception, we can account for getting aced differently. I recommend reading a more in-depth description by Chad Gordon here. Rather than rehash all of what Chad wrote, I’ll keep it simpler here. If xFB is designed to tell us more about how a team should expect to score, then getting aced not only means not scoring but actually scoring for the other team. In that sense, it is the same as an attack error so let’s treat it that way in our xFB equation.
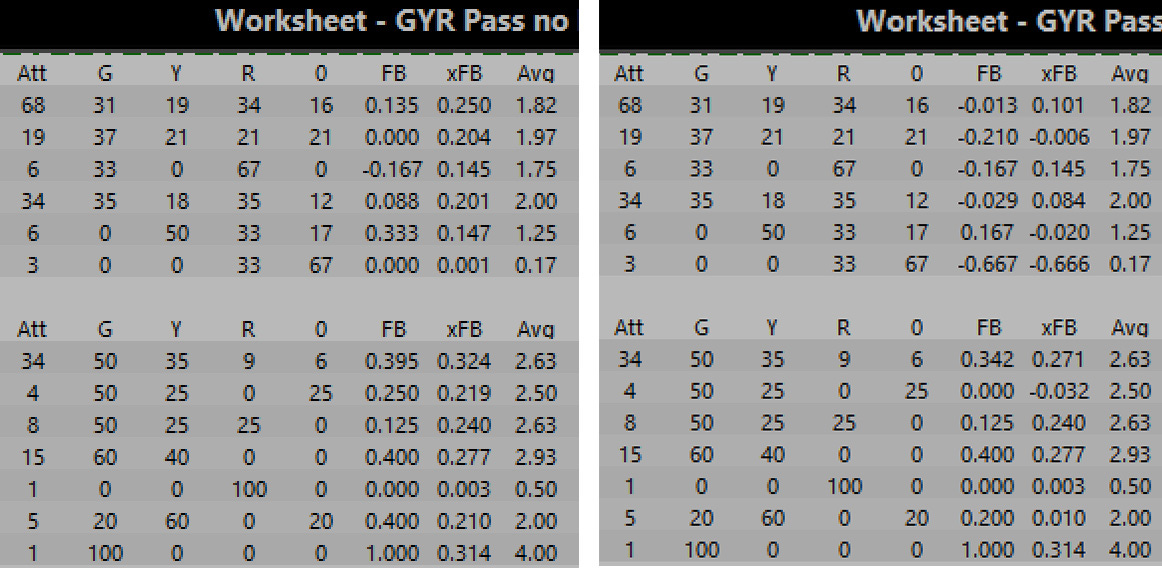
Before:
After:
This small change can lead to some very different xFB values because any aces are changing from 0 penalty to a penalty of -1. Let’s compare using the same match from above.
Compare the 1.97 passer to the 2.00 passer again. The nine-point difference in their 0% values is now very clear. All the extra aces for the 1.97 passer change their xFB from a not-that-bad .204 to -.006 (210 points) while the 2.00 passer’s xFB drops only around 120 points. Neither of these are good but it becomes easier to see which one is worse. I currently use the version of the calculation that penalizes for aces but I have found that it has drastic effects on numbers once a player gets aced. The math is an accurate representation of what happens to the score but I feel like I have a harder time assessing a passer’s performance looking at just xFB.
That brings me to a very important point about all of these calculations, they all have aspects of performance that they don’t describe well. As a result, I use all three in order to get a more complete picture of reception performance. In talking to our coaching staff, I will usually lead with reception average because that’s what they’re most accustomed to hearing. I will follow that number up with either xFB or G-Y-R, depending on the context in the moment. I do my best to adhere to one of Nate Ngo’s guiding principles, “how do I tell the story of the match with appropriate context but without overwhelming?” This is when it becomes clear that all these numbers are only tools that I can use to tell the story of player performance. I can’t expect the numbers to do all the work, I have to use my understanding of each value to describe player performance. This is important because those descriptions ultimately affect how coaches work with players.
G-Y-R can have an impact on how coaches work with players. I don't think that it changes how they want their players to look and move but I do think G-Y-R should shift their interest and energy when working on reception. Knowing that there isn't much difference between a “three” and a “four” in terms of scoring, how much energy should they put into improving a pass' location from 6-7 feet off the net to 1-2 feet off? But what about improving pass location from 11-12 feet off to 6-7 feet off? That's a potential difference of 100 points in hitting efficiency. How important is the height of a pass? A low pass to the center of the court may not prevent our setter from getting to it but it may prevent her from setting it with her hands. For me, that may be the difference between a “two” and a “one. That means passing a ball to that same location but higher can mean a 150-point increase in xFB. To me, this is a different perspective on improvement. Improvement can mean raising the ceiling on our performances, that our average performance improves because our top scores consistently become a little better. But G-Y-R gives us a way to quantify the benefit of raising the floor, making our lowest performances better. In this case, raising the floor means changing Rs to Ys while raising the ceiling is changing 3s to 4s. G-Y-R suggests that raising the floor would have a much bigger effect on our ability to side out than just seeking general improvement that is reflected in reception average.
G-Y-R also gives me an alternative way to think about scoring reception games in practice. We play a serve receive offense game at Colorado where points are awarded based on the quality of our pass and the outcome of the first ball attack. What if we changed the scoring to incorporate G-Y-R? What if we rewarded teams that outperformed the xFB of a particular pass? What if we penalized serving teams that knocked their opponent out of system but then allowed a kill? What if we changed xFB to not penalize getting aced so much? Would it hurt our descriptions of performance? There are plenty of options. I hope you go explore.


