Number Theory - eV with Chad Gordon (part 1)
Expected Value
I first got to know Chad Gordon at a random restaurant at the NCAA women’s volleyball tournament semifinals because we didn’t bother to get tickets to the matches. I had sent him a blind email to see if I could pick his brain and he said of course and it’s been all downhill since then. I blame him for my use of Tableau. He recently joined VolleyStation to lead their computer vision efforts. He was AVCA’s Boys Club Coach of the Year in 2021. You can read his blog here. He’s on Instagram and what I continue to call Twitter.
What is Number Theory? - Read here
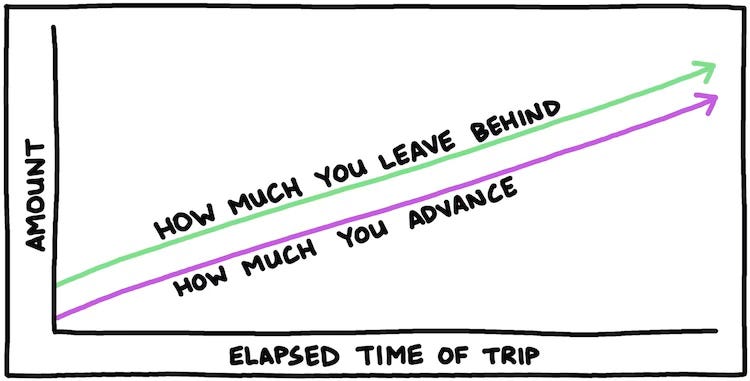
If you want to take a journey into Expected Values with Chad Gordon, there are two ideas you need to consider, detail and probability. The good news is that you don’t have to take a statistics class to come on the journey. The bad news is that taking the trip might make you leave behind some ways you’re used to looking at volleyball. Trust me, it’s worth it.

Let’s start with the bad news. The stats you’re used to using, like attack efficiency and reception average? It’s not that they’re bad, it’s just that you can do so much better. Those stats are a step up from just counting things that happen because they give some additional information. They describe the rate at which teams and players are doing things or the relative frequency of a thing happening. These kinds of stats are useful but there’s still more out there.
Adding more detail to traditional stats doesn’t turn them into expected values but adding information is the first step on the journey. Detail is something that you’re probably already including in some form. For instance, how does an attacker perform in first ball offense versus transition? That’s more detail than just attack efficiency. You likely add more layers of detail onto those same questions, like how well does an attacker perform on in system first ball attacks versus out of system first ball attacks? If you’re already looking at details, then what’s the benefit of Expected Value (eV1) for you? And is that the only bad news?
No, the biggest piece of bad news is that most stats, in their most basic forms, isolate skills from one another. But you know from watching the game that each touch of the ball influences the touches that follow. Adding detail feeds in more information about previous contacts, but this only begins to address the problem because traditional metrics, even with all the details you could add in, only give you information about a single contact. Because those metrics only describe single contacts, it’s virtually impossible to compare performances across skills. Maybe the biggest idea you should leave behind on the eV journey is using isolated stats when trying to understand winning. Chad writes that the goal of eV is to describe all skills using a single language, “the currency of points”, instead of contacts.
The first step in translating to points is evaluating skill performance in terms of the outcome of the whole rally instead of just an evaluation of that contact. Since most traditional stats are about single contacts, they don’t give you a better understanding of what you’re really trying to figure out, which is if that contact helped you win the rally. This is where eV begins to show its benefits. The assortment of stats that are commonly used in volleyball often have no direct connection to winning rallies. And when a stat does refer to scoring points, it often does so in a way that isn’t very easy to wrap your head around. Points win matches, efficiencies and averages don’t.
Traditional attack efficiency, for example, measures attacking in terms of what fraction of a point a team earns per attack and that amount can vary anywhere between +1 (the team earned one point with each attack) and -1 (the team gave away one point with each attack). So, while it is possible to say that a team hits .100 after passing a 1 in serve receive, you can’t tell if the attack that follows such a reception was actually worth 1/10 of a point. You can tell if a whole point was won or lost but about half of all attacks (in most women’ NCAA Division I matches, anyways) remain in play. If the ball remains in play, how do you know if the team earned the 1/10th of a point they should have gotten? This line of thinking encourages you to think that the team will have to take 10 of those swings before the team earns a point. Instead, Chad’s use of eV demonstrates that there’s a much better way to think about winning rallies. It gives you a more intuitive way to interpret outcomes as well as allowing you to relate skills to each other in a much more useful way.
To understand this more intuitive way, you’ll need to exchange fractions of a points for the probability of winning the rally. When Chad starts talking about probabilities, he encourages you not to panic. And then he says, and I quote…
Most people don’t have much exposure to the formal study of statistics, hence the feeling of panic upon hearing “probability”, but you’re actually already familiar enough with the term to use it in the context of eV. A coin flip, as you know, has a 50% probability of coming up heads. That’s about all you need to understand eV, 50% is an anchor point to help you orient yourself to how likely or unlikely an event (in this case, winning a rally) is to happen. The probability of winning a rally varies between 100% (a team should win the rally every time they are in a situation of that probability) and 0% (a team should never win the rally any time they are in a situation of that probability). Any probability less than 50% is more likely not to happen and any probability greater than 50% is more likely to happen. Chad thinks in terms of “how far from 50% are you” in any given situation. In the same post where he writes that, he also shows how easy it is to convert from an efficiency to a probability (expected value) and I encourage you to read his writing to see how that’s done. Instead of describing that here, I want to explain why using a probability is actually more intuitive than using an efficiency or an average.
I explained above how an attack efficiency forces you to think in fractions of a point and how it doesn’t give any meaning to attacks that stay in play. Probability makes it easier to understand not just when a point is earned but also when play continues. Using Chad’s conversion, the .100 attacking situation I mentioned above equals a 55% probability of winning, which means there is a slightly better than 50/50 chance of winning the rally when that situation occurs. To think in Chad’s terms of “how far from 50% are you?”, a probability of 55% means that an outcome is almost as likely to happen as it is not to happen. So when you know the probability of winning a rally when a certain situation occurs, you have completed the translation from contacts to points. You’re now measuring things in terms of how likely they are to lead to winning rallies. But there’s another, even better, reason to use probabilities: you can compare performances across skills.
To show how different skills can be compared in a common language, ask this question: “given the situation, what do we expect to happen?” Notice that it doesn’t matter which contact you’re considering, what matters is the situation in which the contact is happening. There are two sides to the mental equation in that question, the inputs and the output. The inputs are the “current situation”, and Chad describes one possible situation like this: a rally “starts with a tough serve that forces an out of system set from deep in zone 6. There are 3 blockers waiting for the outside hitter on the incoming high-ball.” Each of those details carry a probability of winning the rally in which this situation happens. They are combined together to give an output, which is the probability of that outside hitter scoring on that attack. That output is the eV of that contact.
It becomes clear that an eV can be calculated for any touch in a rally and that those values can be compared for any skill. In Chad’s description above, the play begins with an out of system pass. In the data I have collected for my team, a pass of that quality yields an eV of 52%. You can compare that directly to the 55% eV of the attack that was estimated, which is a comparison that is not possible if you measure reception with an average and attacking with an efficiency. You can make similar calculations for any contacts and any inputs you are interested in and have data for. But comparing skills to one another is only part of eV’s benefit. The question still remains: why use eV instead of traditional metrics if you don’t care about comparing skills to one another?
Using eV, which is a probability, lets you compare the outcomes you see to what you expected to see in a meaningful way, even for the same skill. This is important because your understanding of situations and outcomes affects your decision making. Perhaps the most important thing performance analysts, statisticians, and technical coordinators do with probabilities is frame how decision makers (coaches) view things that happen. When an analyst gives a coach probabilities about certain situations, the coach can then set their expectations appropriately about what actually happens each time that situation occurs during play. This is accomplished much better with probability than it is with efficiency. It’s hard to know what to think about an attack that’s worth 1/10th of a point if the attack stays in play. But if an attack with an eV of 55% stays in play, it’s much easier to decide if you should be surprised by the outcome or not. If you know which outcomes are surprising and which are not, you can make better decisions.
Describing the value of eV is a decent journey but there’s still a ways to go. Still to come is how eV can be used as a comparative tool and, for those with more interest and tools, how to calculate your own eVs. But, in the words of Andy Dufresne…
Number Theory - eV with Chad Gordon (part 2)
This is the second part of eV. Please read part one to better understand what’s being discussed here. In part one, I explained how Expected Value (eV) can be more intuitive and beneficial than traditional skill performance metrics. This part will show examples of eV being used to compare expected outcomes to actual outcomes.
Have questions for Chad? You can ask me here or you can email him directly.
Why the lowercase e? I’ll let you ask Chad but I suspect that it’s in keeping with soccer’s use of “xG” for Expected Goals. Why does xG use a lowercase x? I’ll let you ask some soccer data analysts.


